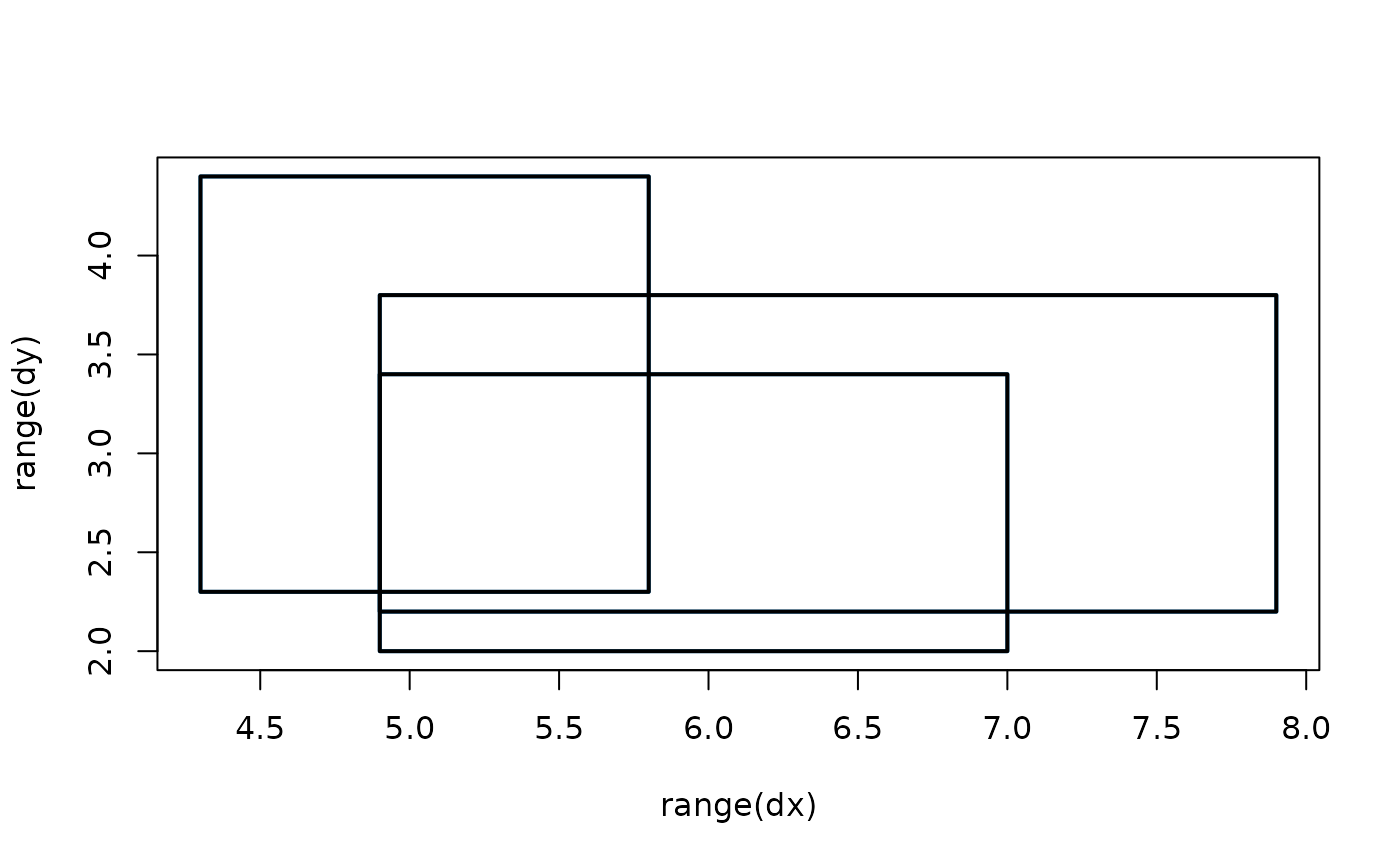
Generates a visual representation of interval data as rectangles on a plot.
plot.interval.RdGenerates a visual representation of interval data as rectangles on a plot.
# S3 method for class 'interval'
plot(x, ...)
Arguments
Value
No return value, it plot the interval.
Examples
plot(iaggregate(iris, 5))

plot(iaggregate(iris, 5), col = 4)
plot(iaggregate(iris, 5), add = TRUE)
