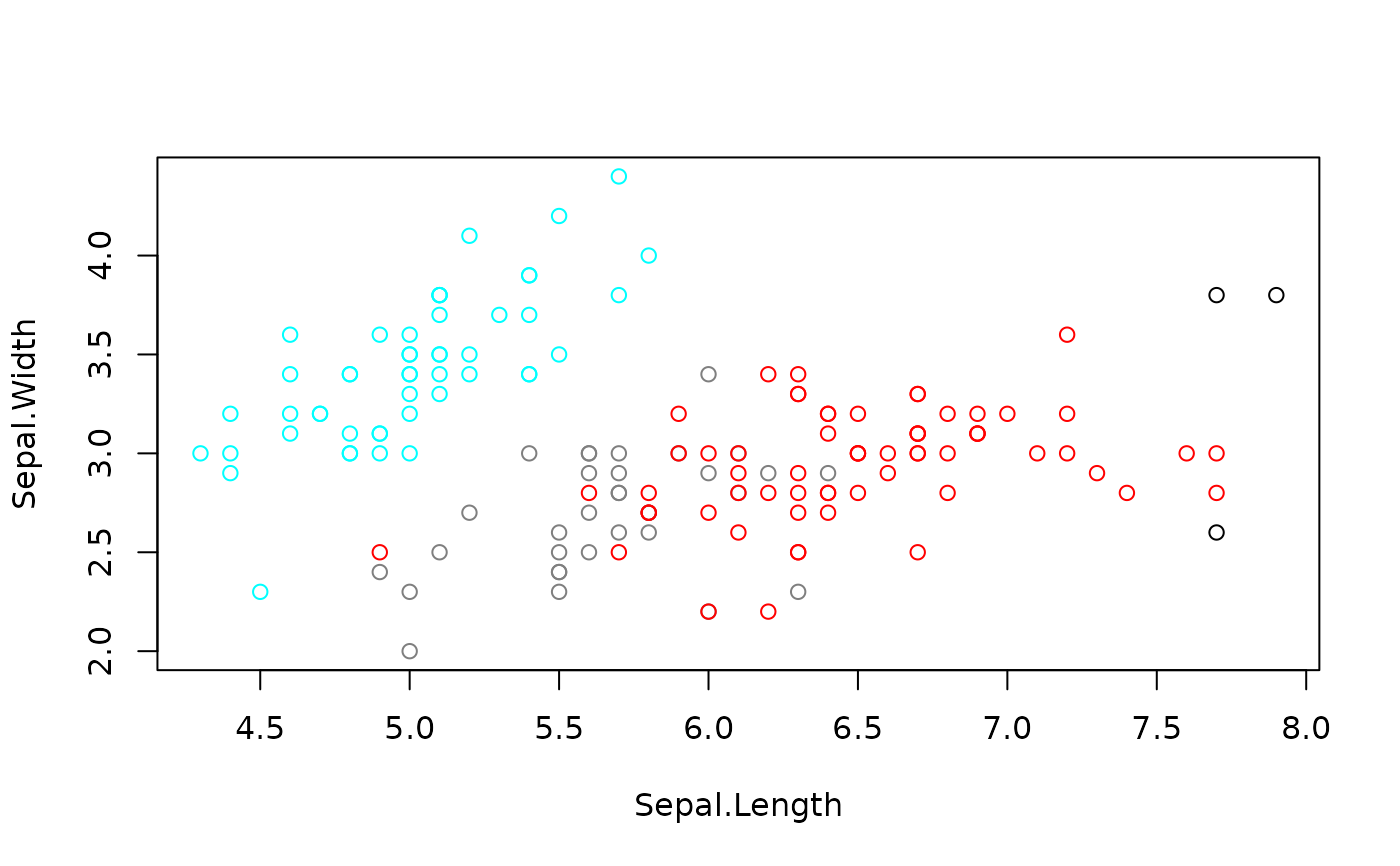
Generates a color for each data point based on its clustering assignment, facilitating visual distinction of clusters in plots.
cluster_color(x)Arguments
Value
A character vector of colors (in hexadecimal format) corresponding to the clustering assignments, suitable for use in plotting functions.